Installation can be done by running the script below.
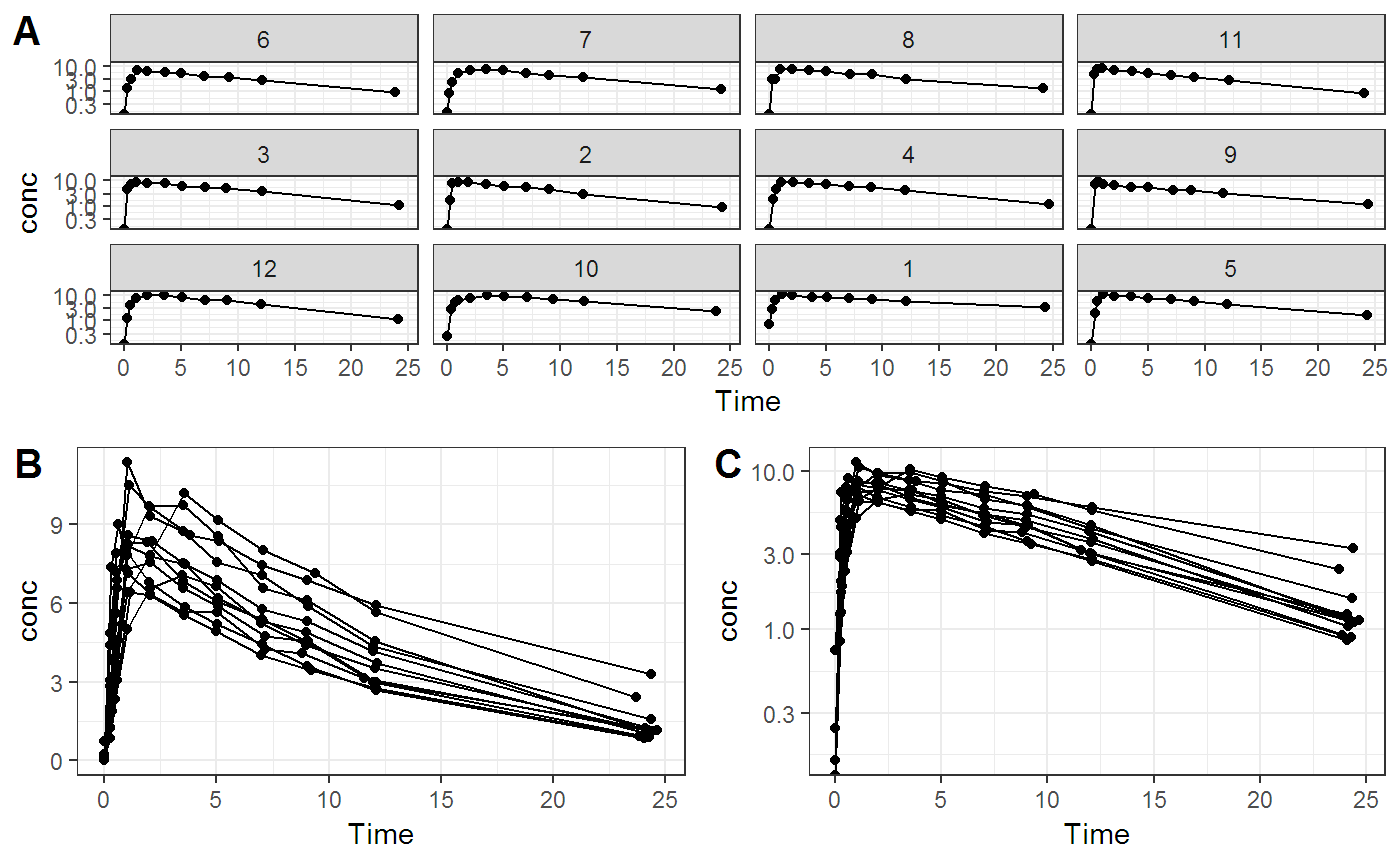
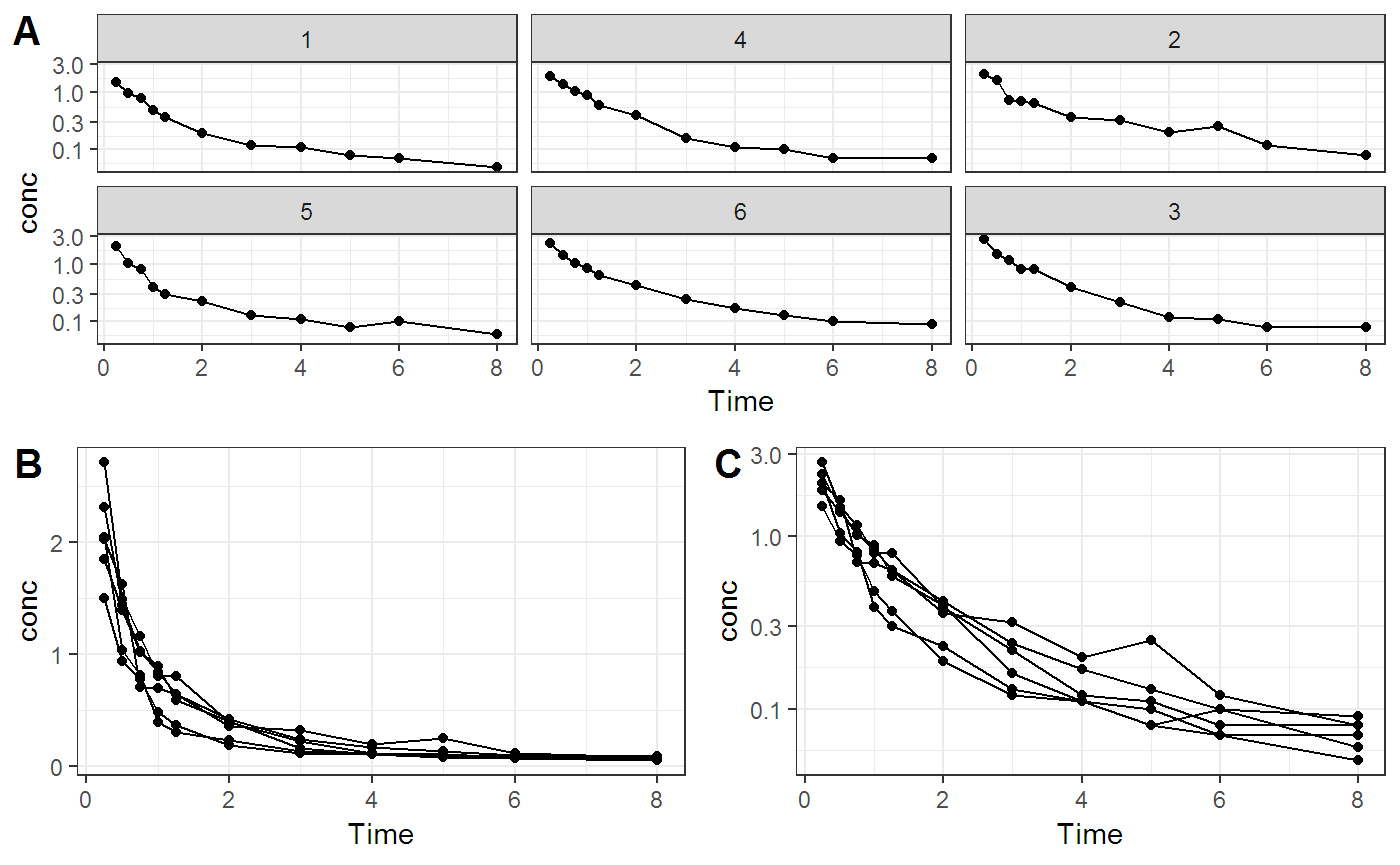
Here are some examples.
Future references
여기서 예제를 올리고 이를 응용해서 PK plot을 그려 나갈 예정입니다.
ggplot2::qplot(x=Time, y=Conc, group=ID, color = Race,
               data=PKPDdatasets::sd_oral_richpk,
               log = 'y',
               geom=c('line', 'point'))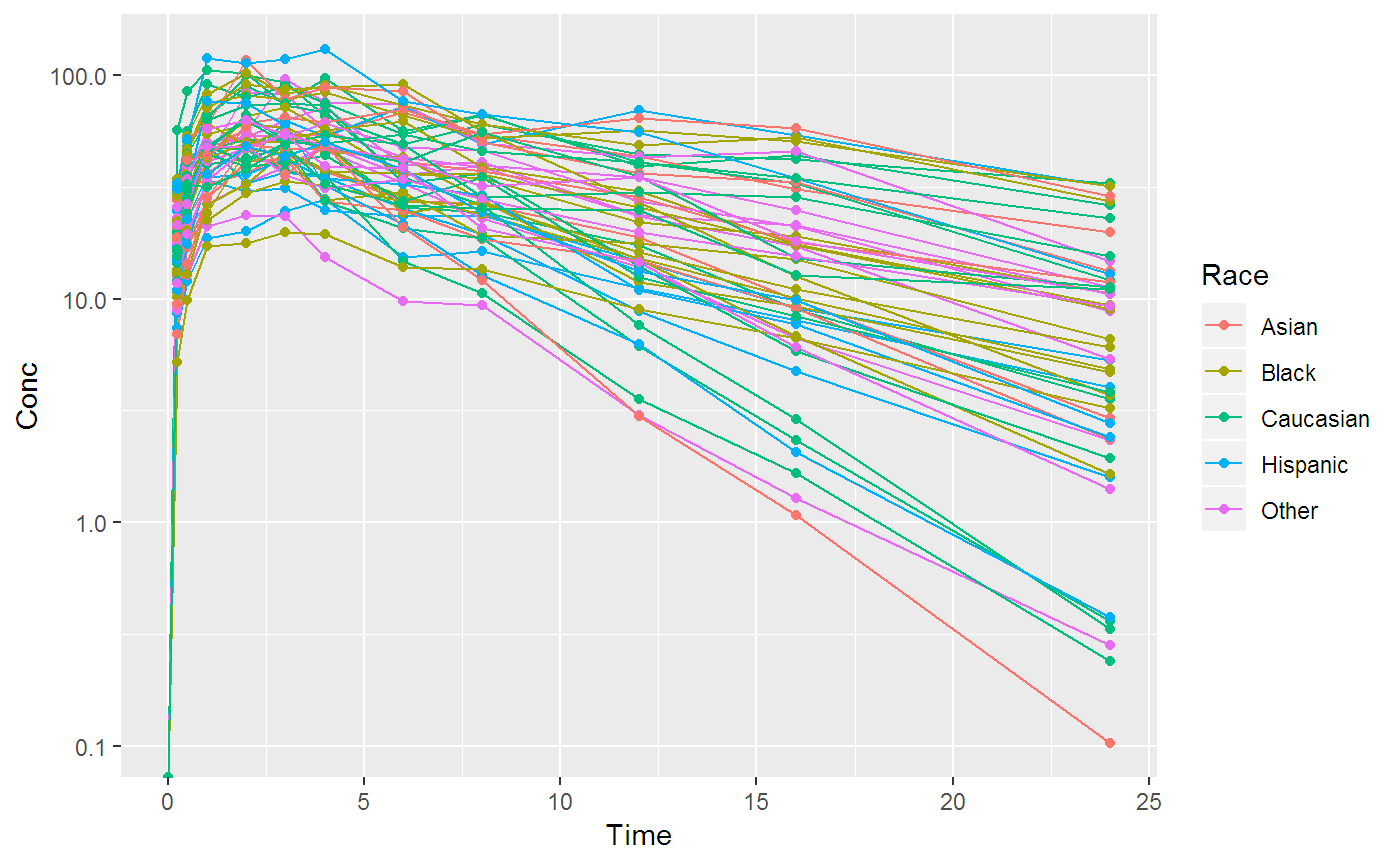
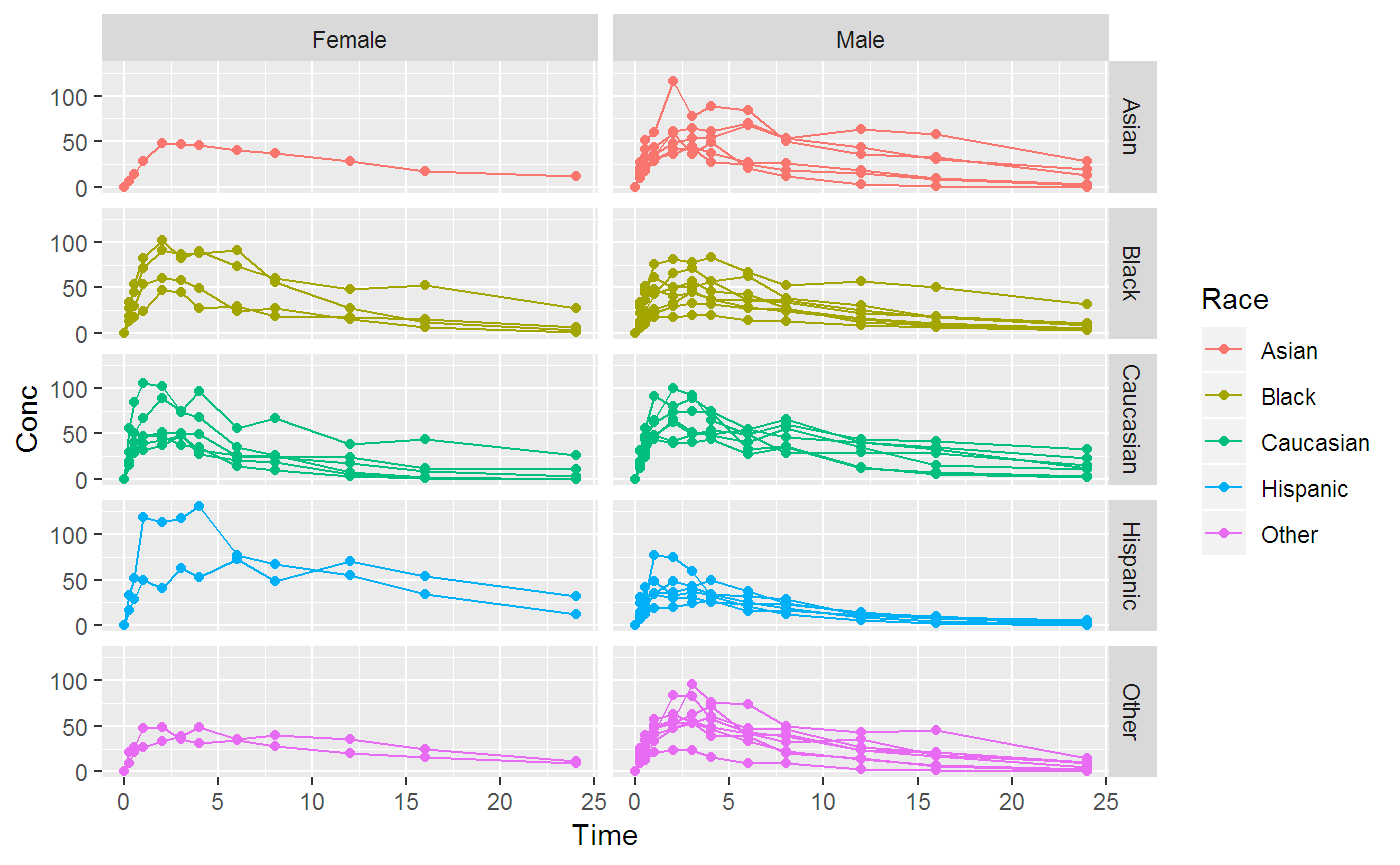
ggplot2::qplot(x=Time, y=Conc, group=ID, color = Race,
               data=PKPDdatasets::sd_oral_richpk,
               facets = Race ~ Gender,
               geom=c('line', 'point'))