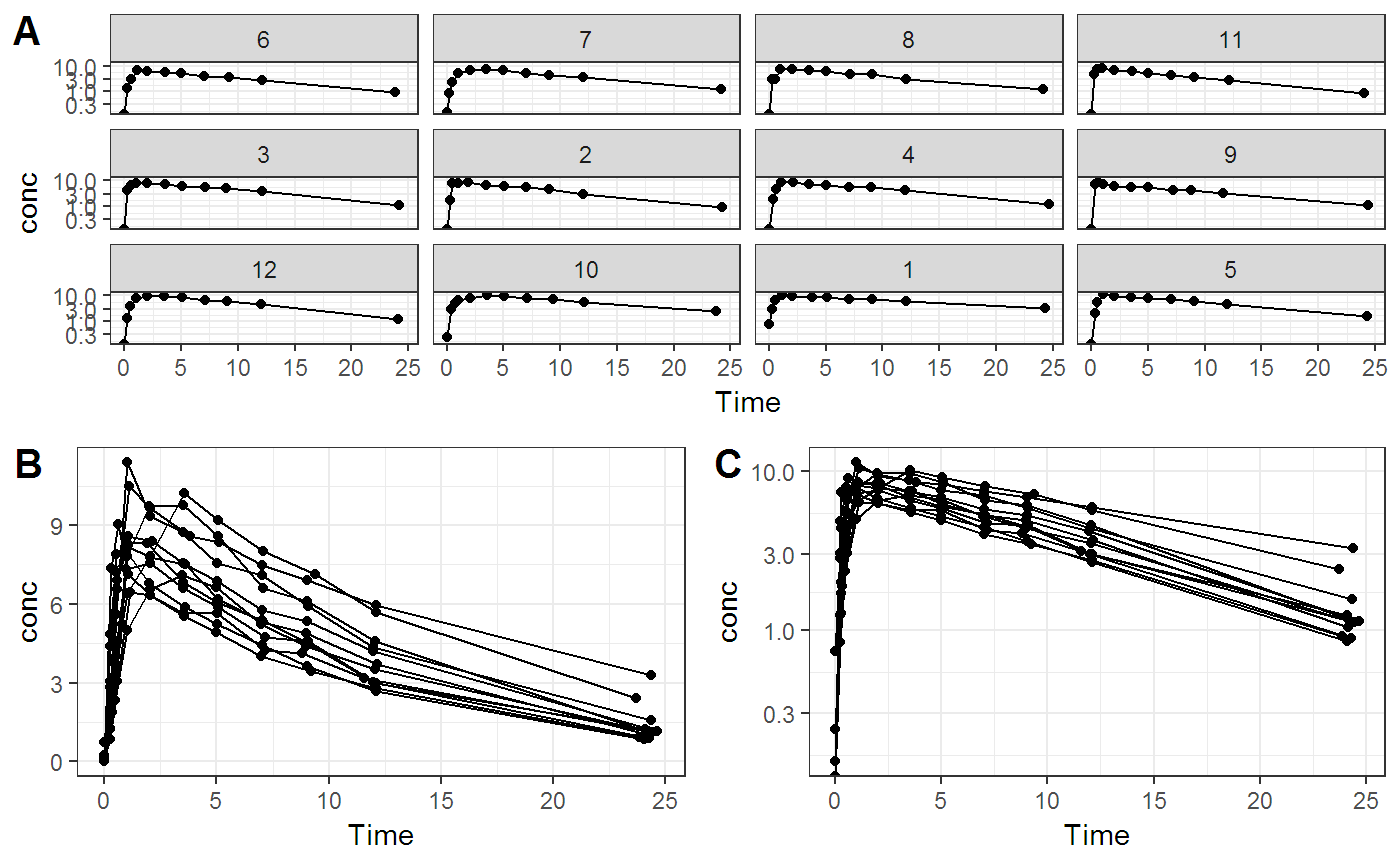
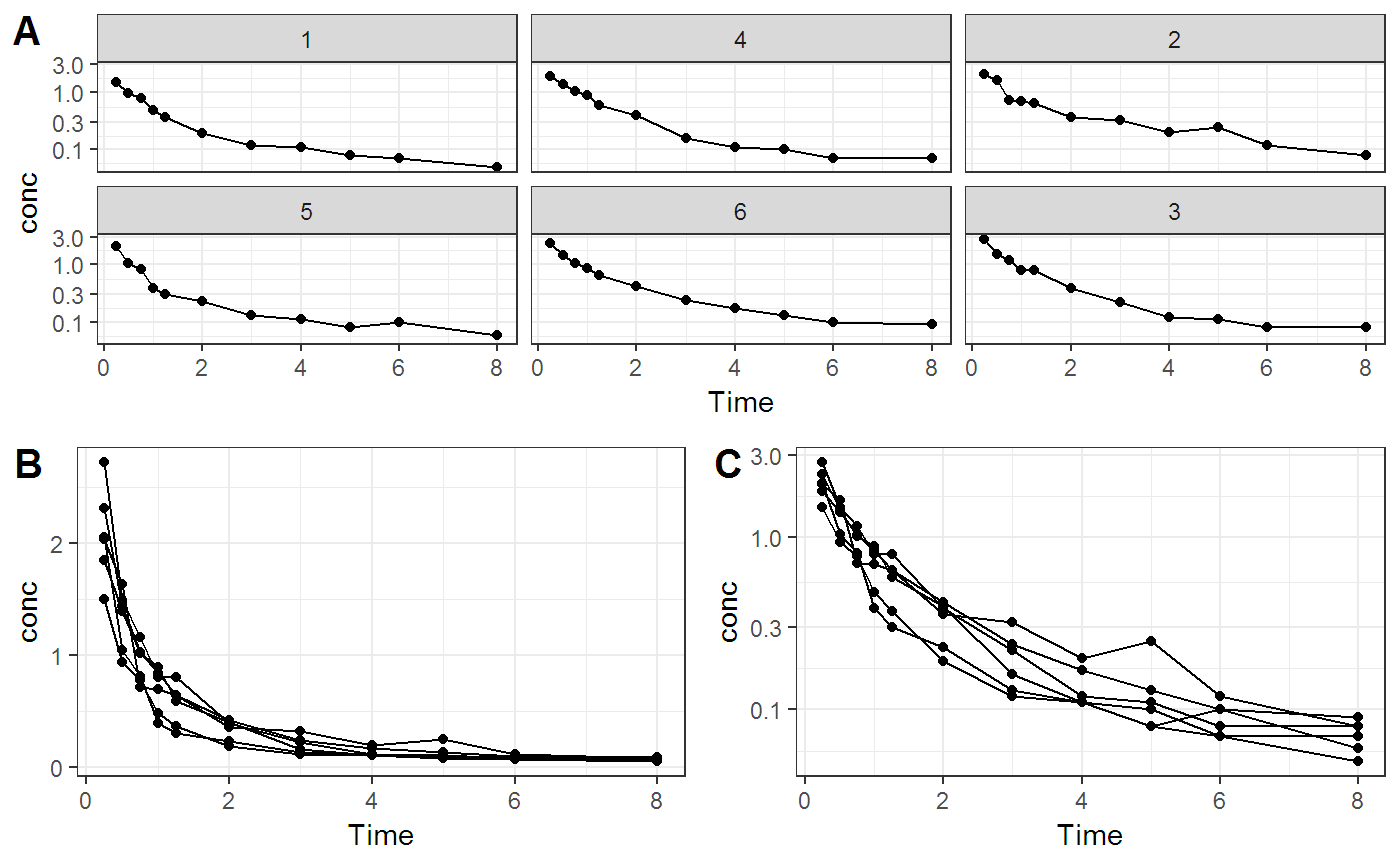
This draws pharmacokinetic concentration-time curve with ggplot2 packages.
plot_nca(concData, colSubj = "Subject", colTime = "Time",
  colConc = "conc")
Arguments
| concData | concentration data table |
|---|---|
| colSubj | column name for subject ID |
| colTime | column name for time |
| colConc | column name for concentration |
Value
ggplot2 figures
Examples
plot_nca(concData = Theoph, colSubj = "Subject", colTime = "Time", colConc = "conc")#> #>#> Warning: Transformation introduced infinite values in continuous y-axis#> Warning: Transformation introduced infinite values in continuous y-axis#> Warning: Transformation introduced infinite values in continuous y-axis#> Warning: Transformation introduced infinite values in continuous y-axisplot_nca(concData = Indometh, colSubj = "Subject", colTime = "time", colConc = "conc")#> #>