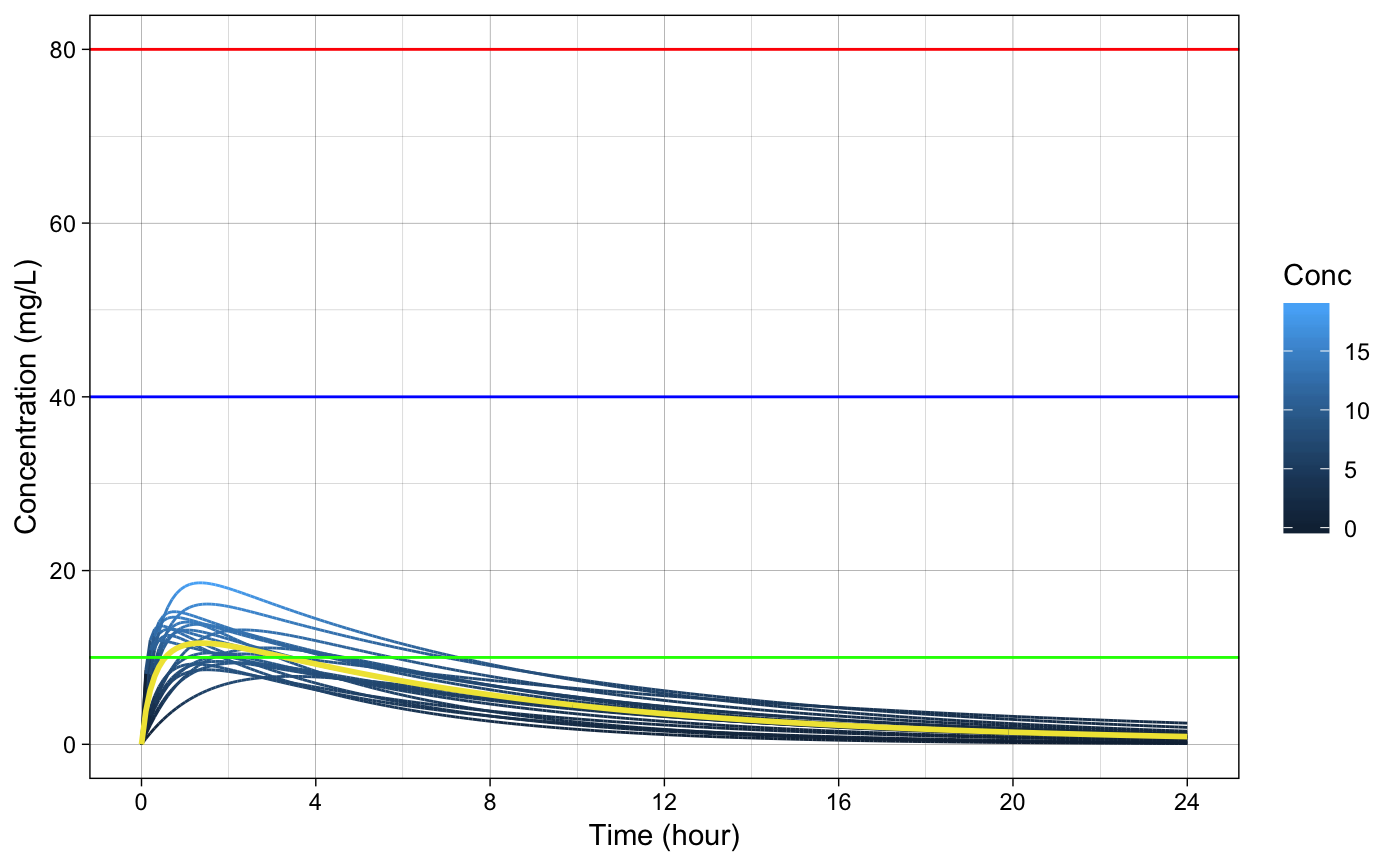
Plot plasma concentration-time curves of single oral dosing of caffeine
Source:R/caffPlot.R
caffPlot.RdcaffPlot will create concentration-time curve after single dose of caffeine
caffPlot(caffConcTimeData, log = FALSE)
Arguments
| caffConcTimeData | data frame of concentration-time dataset having column names Subject, Time, and Conc (case-sensitive) |
|---|---|
| log | y axis log |
Value
The concentration-time curve