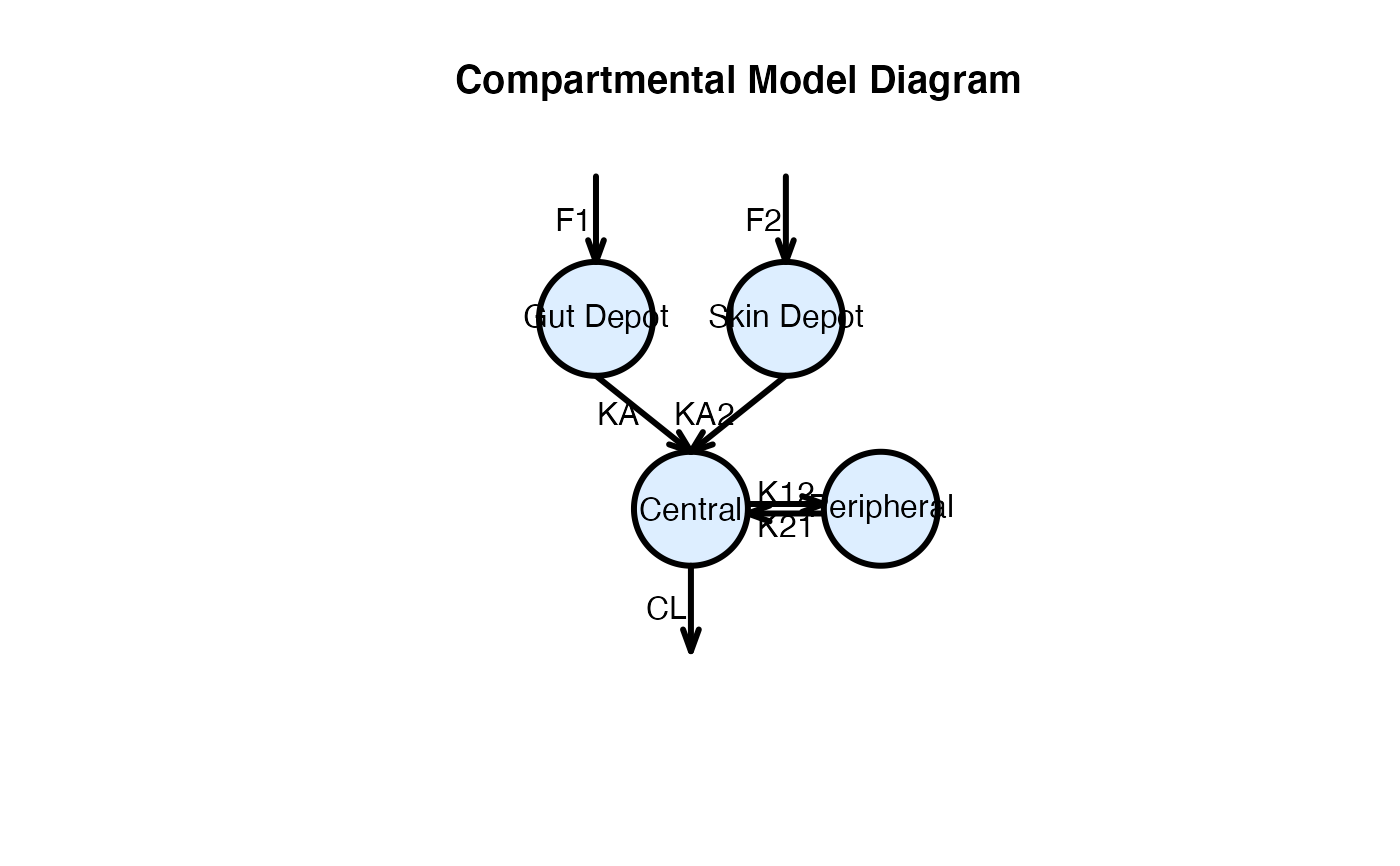
Plot Compartment Model Diagram
pComp.RdIt plots the diagrom of a comparment model.
pComp(dComp, dRate, Shape="rect", Col=NA, Bx=0.3, By=0.2, Cex=1.0, Lwd=3,
      Radius=0.3, thIn=pi/2, thOut=pi/2, ...)
Arguments
| dComp | data.frame for a compartment model. See the example. |
|---|---|
| dRate | data.frame for rate information. See the example. |
| Shape | rectangle or cricle |
| Col | filling color |
| Bx | half width of compartment box |
| By | half height of compartment box |
| Cex | character expansion |
| Lwd | line width |
| Radius | radius of compartment circle |
| thIn | Input angle in radian |
| thOut | Output angle in radian |
| ... | arguments to be passed to |
Details
Flow direction is from the top to bottom.
Value
It plots.
Author
Kyun-Seop Bae <k@acr.kr>
Examples
dA = data.frame(No = c(1, 2, 3, 4), Name=c("Gut Depot", "Skin Depot", "Central", "Peripheral"), Level=c(1, 1, 2, 2), xPos=c(-0.5, 0.5, 0, 1)) dB = data.frame(From = c(1, 2, 3, 4, 3, 0, 0), To=c(3, 3, 4, 3, 5, 1, 2), Name=c("KA", "KA2", "K12", "K21", "CL", "F1", "F2")) pComp(dA, dB)#par(oma=c(0, 0, 0, 0), mar=c(0, 0, 1, 0)) # If need, adjust margin before calling pComp(dA, dB, "circ", main="Compartmental Model Diagram")pComp(dA, dB, "circ", main="Compartmental Model Diagram", Col="#DDEEFF", asp=1)